


Smart Studio
Smart Studio

Lens Effect 3D
Lens Effect 3D

Optic Studio
Optic Studio
Quantitative meibomian gland analysis: from images to objective data
April 1, 2026
Meibomian Gland Dysfunction (MGD) is a structural disease before it becomes symptomatic. While traditional
meibography provides visual documentation of gland morphology, modern ophthalmology is rapidly evolving toward
quantitative meibomian gland analysis powered by advanced software algorithms.
Quantitative meibography software transforms gland images into measurable parameters, reducing subjectivity and
improving clinical decision-making.
For specialists and distributors evaluating next-generation MGD diagnostic devices, understanding the shift from
qualitative imaging to objective data analysis is essential.
From qualitative imaging to quantitative evaluation
Traditional meibography relies primarily on visual interpretation:
- Gland dropout estimation
- Morphological distortion assessment
- Morphological distortion assessment
However, clinician-dependent interpretation introduces variability. Two practitioners may assign different severity
scores to the same image.
Quantitative meibography software addresses this limitation by converting gland images into reproducible numerical
metrics.
What is quantitative meibography software?
Quantitative meibography software is a digital analysis system integrated within a meibography device or ocular
surface analyzer.
It processes infrared gland images to extract measurable parameters such as:
- Percentage of gland dropout
- Total gland area
- Gland density
- Tortuosity index
- Structural irregularity patterns
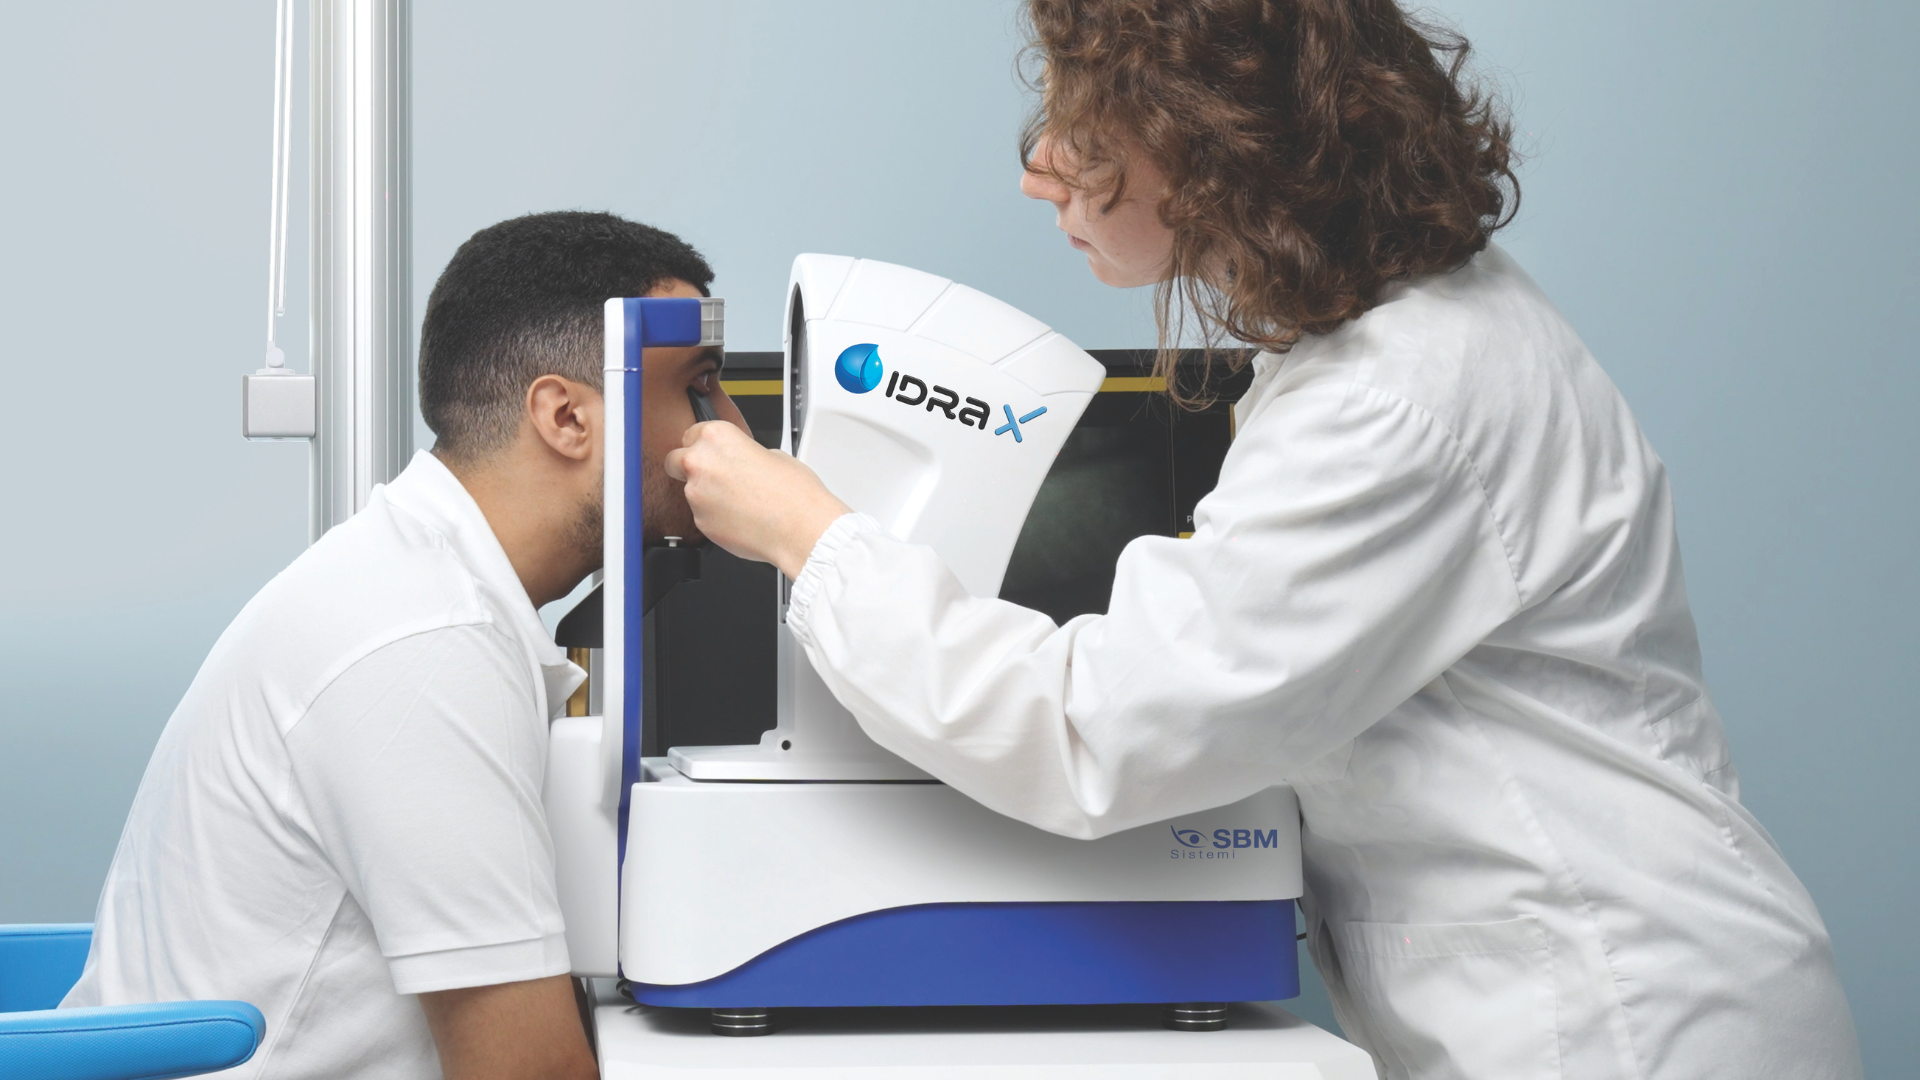
Integrated platforms such as IDRA X incorporate advanced imaging modules capable of supporting structured gland evaluation workflows
By combining imaging with analysis tools, clinicians move from descriptive reporting to data-driven assessment.
High-precision optical systems such as OS1000X also demonstrate how advanced imaging hardware plays a fundamental
role in ensuring accurate structural acquisition before software-based analysis.
Hardware quality directly influences the reliability of quantitative outputs.
How quantitative analysis works
The workflow typically includes:
- Infrared image acquisition
- Digital segmentation of gland structures
- Automated or semi-automated boundary detection
- Calculation of glandular surface area
- Generation of a numeric severity score
Accurate segmentation depends heavily on imaging quality, making robust optical platforms — such as those implemented in systems like OS1000X — essential for consistent quantitative evaluation.
Clinical applications of quantitative meibomian gland analysis
Early MGD detection
Quantitative software detects subtle gland area reductions that may not be visually evident.
This allows:
- Earlier therapeutic intervention
- Identification of subclinical MGD
- Risk stratification for digital device users
Treatment planning and monitoring
Objective gland metrics are particularly valuable when combined with systems such as Activa.
By documenting baseline gland status before treatment, clinicians can:
- Compare pre- and post-treatment gland metrics
- Evaluate therapy response objectively
- Adjust treatment protocols
Quantitative monitoring enhances clinical credibility and patient confidence.
Research and clinical trials
Standardized numerical data enables:
- Multi-center study comparability
- Longitudinal research tracking
- Evidence-based protocol development
High-resolution imaging platforms combined with quantitative software create robust datasets suitable for scientific research.
Advantages over traditional grading systems
Conventional MGD grading scales often classify gland loss into broad categories (mild, moderate, severe).
Quantitative systems offer:
- Exact percentage values
- Reduced inter-observer variability
- Standardized follow-up documentation
- Improved medico-legal traceability
This aligns with the broader transformation of ophthalmology toward objective and measurable diagnostics.
Integration within comprehensive ocular surface analysis
Quantitative meibomian gland analysis becomes significantly more powerful when integrated with additional tear film parameters such as:
- Non-invasive Tear Break-Up Time
- Lipid Layer Thickness
- Tear Meniscus Height
- Blink Dynamics
Strategic value for distributors and OEM partners
From a distribution perspective, quantitative meibography software represents a strong competitive differentiator.
Distributors evaluating ophthalmic device manufacturers should prioritize systems that provide:
- Integrated software-hardware solutions
- Scalable analytics modules
- Future AI upgrade capability
- CE-certified manufacturing
- Long-term technical support
Quantitative meibography software marks a decisive shift in MGD diagnosis, from subjective image interpretation to
objective, reproducible data analysis.
By converting gland morphology into measurable metrics, clinicians improve diagnostic accuracy, treatment
monitoring, and research reliability.
When integrated into advanced ocular surface analyzers such as IDRA X, supported by high-precision topographers like
OS1000X, and combined with therapeutic technologies such as Activa, quantitative meibomian gland analysis becomes a
cornerstone of modern dry eye management, delivering both clinical precision and strategic commercial value.
Read more
Objective vs subjective meibography: why quantification matters
Dry Eye in dogs and cats: beyond the Schirmer Test
The business case for Dry Eye clinics: revenue opportunities and patient retention
How corneal topography helps detect keratoconus in early stages
Automated Dry Eye diagnosis: how technology improves repeatability and workflow
Corneal Topography and Dry Eye: why both matter before cataract surgery
Tear film layers explained: lipid, aqueous and mucin
How to build a complete Dry Eye diagnostic workflow in your clinic
How to choose a Dry Eye diagnostic device for your practice
Meibomian gland dropout: early detection with advanced imaging
How objective Dry Eye diagnostics increase clinic revenue
Objective Optical Quality Metrics in Modern Ophthalmology
Regulatory Considerations When Importing CE Certified Ophthalmic Devices
OEM Opportunities in Ophthalmic Diagnostic Equipment
Best non-invasive tests for Dry Eye diagnosis in 2026
Transillumination meibography: clinical applications and advantages
What is a Tear Film Analyzer Device and how does it improve Dry Eye diagnosis?
Ocular surface assessment in high-volume clinics: efficiency without compromising accuracy
Beyond dry eye: other ocular surface disorders that impact visual quality
The role of ocular surface inflammation in post-surgical patient dissatisfaction
Ocular surface evaluation in contact lens wearers: what clinicians often miss
Environmental and lifestyle factors that alter tear film stability
Tear Film health in French Bulldogs: what the latest study using OSA-Vet® reveals
Pre-surgical dry eye screening: which parameters really influence outcomes
Optimizing the ocular surface before cataract surgery to improve surgical accuracy and patient outcomes
Dry eye and cataract surgery: managing expectations through objective preoperative evaluation
Evidence-based guidelines for cataract surgery: improving outcomes through standardized clinical practice
Meibomian gland dysfunction: why early detection changes long-term patient outcomes
Meibography and MGD: from gland imaging to clinical decision making
Non-invasive tear film assessment: clinical advantages over fluorescein-based methods
Tear film analysis explained: LLT, NIBUT and tear meniscus in clinical practice
Why traditional dry eye tests are not enough: limits of Schirmer and TBUT in modern practice
Dry eye diagnosis today: why ocular surface analysis is no longer optional

Attention: The information on this page is intended exclusively for qualified healthcare professionals.


